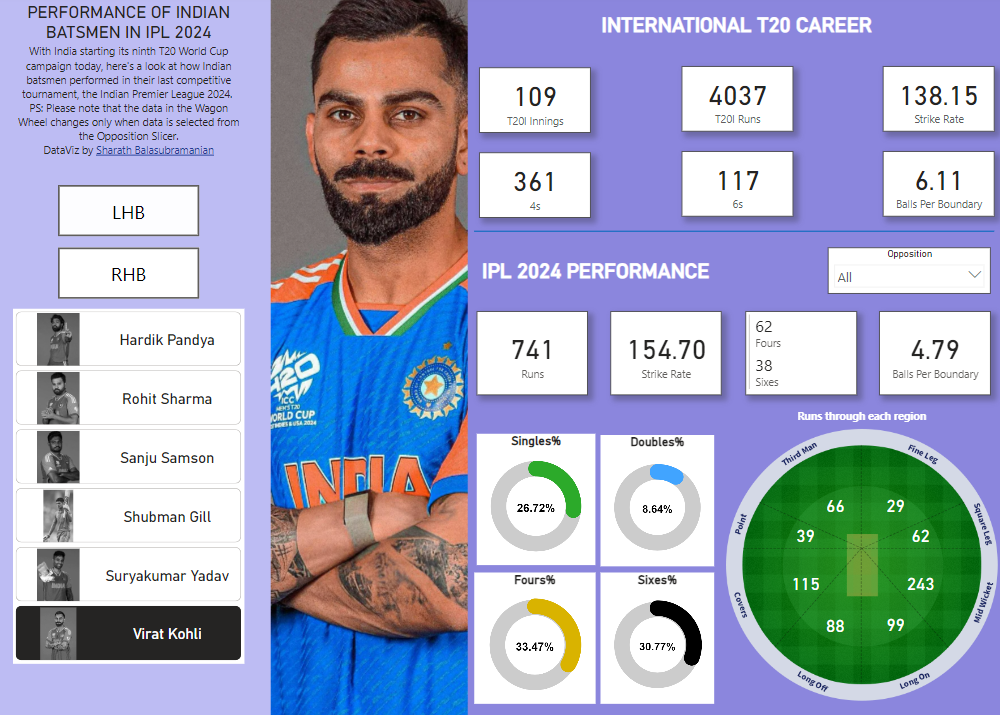
When I was working as an analyst for multiple cricket teams, we used to look at the trends in the most recent performances of players. With India locking horns against Ireland tonight in the ninth edition of the T20 World Cup, our batsmen will hold the key in the tournament.
The recently concluded Indian Premier League saw plenty of runs scored with multiple records being broken. Rohit Sharma, Virat Kohli, Yashasvi Jaiswal, and Suryakumar Yadav (my preferred top 4 for the World Cup as well) scored magnificent centuries for their sides.
I have searched the Internet but couldn’t find many Power BI Visualizations on Wagon Wheel data. The Wagon Wheel data is crucial to understand which areas batsmen usually attack. Though most of them will be down the V region, players like Suryakumar Yadav like going behind the stumps as well! I have also tried using the Common Wealth Bank series’ player infographics as the theme for this report.
We do pitch map data visualizations as well, but due to a time crunch, I was unable to scrape the data for it. I hope to build more data visualizations around player analyses in the coming days. Do let me know who holds the key for us in the upcoming World Cup!

