What an amazing thriller the Cricket World Cup 2023 was! It was disheartening to see India lose in the finals after winning 10/10 matches, but due credit to Australia for putting their bad start behind and putting in an imperious performance in the finals.
Over 23.4 Thousand runs were scored off the bat in the World Cup by 146 batsmen. 2,885 boundaries, fours, and sixes, were hit in the World Cup. Though the number of runs scored is important, one has to look into the Strike Rate (Number of runs scored per 100 balls faced) and the Average (Number of runs scored every innings).
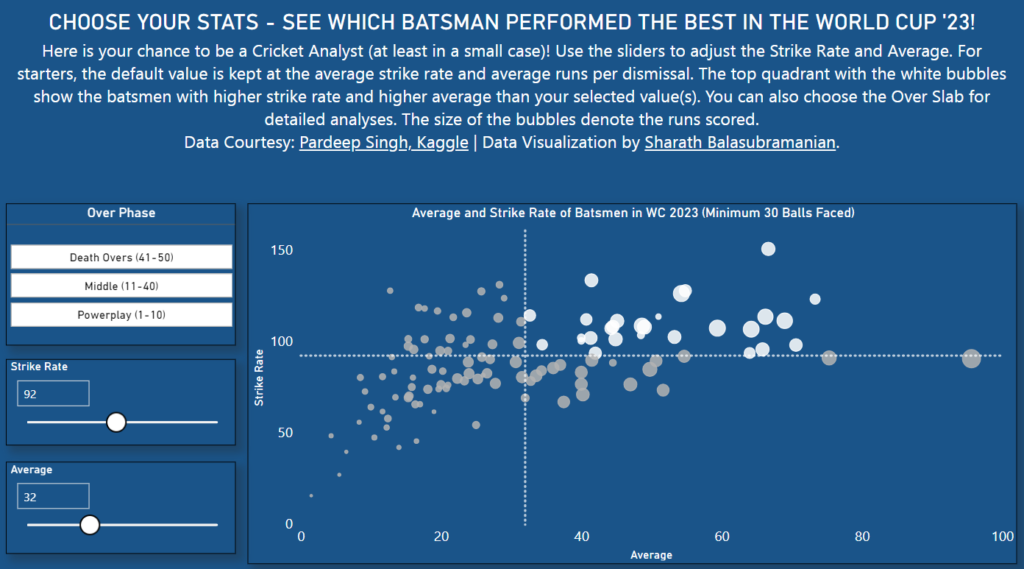
Here is a visualization that shows the distribution of the Average and Strike Rate of batsmen who participated in the World Cup 2023. You can adjust the Strike Rate and Average to see which batsman exceeded the limits that you have set.
You can also go through the Average and Strike Rate of batsmen through different phases of the innings. Please note that a batsman must have faced at least 30 deliveries. Play around with the visualization to see which batsman exceeded your expectations.


As an ardent cricket fan and data science proponent, I find my nephew Sharath Bala’s analysis on the Cricket World Cup 2023 particularly fascinating. His unique approach of assessing batsmen’s effectiveness using an interactive visualization of strike rate and average is commendable. It brilliantly merges the excitement of cricket with the precision of data analytics. This analysis is not just about the runs; it’s a deeper dive into what makes a batsman truly effective in the game’s grand stage. A highly recommended read for those who love cricket and appreciate the power of data.